


Abstract
Central aortic pressure waveforms can be calculated from the radial artery pressure waveform using a generalized transfer function to correct for pressure wave distortion in the upper limb. Although validated to standards conventionally applied, reservations are still expressed on use of this process, because of the relatively small number of patients from whom appropriate invasive data were obtained. The study described here supplemented such data with noninvasive data obtained from carotid and radial artery tonometry in 439 patients and normal subjects. The carotid-radial artery transfer function was similar to the aortic-radial when allowance was made for wave travel from aorta to carotid artery. The carotid-radial transfer function was identical in male and female individuals, was similar at different arterial pressures and in mature adults. Differences are relatively small, are seen at frequencies where central pressure wave components are small and are similar to those seen with vasodilator agents in invasive studies. Findings provide further support for use of a generalized transfer function to calculate aortic from upper limb pressure and conform with previously established views on vascular impedance.
Controversy on this subject has recently sharpened with debate on the utility of transfer functions to generate the central from the peripheral pressure waveform.1–4 The background validity to this approach was established almost 50 years ago with justification of the transfer function approach confirmed on a theoretical and mathematical basis.5–7 Initially highly controversial,8,9 this approach is now sanctioned through acceptance of vascular impedance as the expression of pulsatile pressure/flow relationship in arteries, and ascending aortic impedance as a description of left ventricular hydraulic (after)load.10–12
The initial work done to establish, test, and confirm utility of the transfer function process for generating the central aortic from the upper limb pressure waveform was undertaken some 30 years later13–15 and, after robust challenge,16–18 was confirmed and accepted by regulatory bodies including the US Food and Drug Administration (FDA).19–21 The transfer function used in this study, expressed in the frequency domain, represents the ratio of amplitudes in harmonic series between the carotid and radial artery (radial/carotid in this study). Very recent challenge is based on failure to gain precise aortic values when the peripheral waveform is calibrated by cuff sphygmomanometer1,4 and, when using conventional fluid-filled manometers of low frequency response,2 in association with catheterization-suite recording systems that have damping filters installed for the convenience of clinicians.1,2
The purpose of this article is to present some of the noninvasive validation findings for the methods used, much of which was collected more than 10 years ago. At the time, this was regarded as simply confirmatory of published work and so was published only in thesis or review format22,23 or in abstract form24,25 and in the standard text.12 It does comprise data collected from more than 400 patients and subjects and is therefore the largest published to date in a journal article. The original data are currently unavailable, as a consequence of the translocation of laboratories and the death of one of the principal collaborators, Dr. Ray Kelly.
Methods
The noninvasive studies of transfer functions followed introduction of the Millar tonometer into clinical practice in 1987, its validation against intra-arterial pressure,26 and its use to describe changes in the radial, carotid, and femoral arterial pressure waveforms with age.27
Subjects
Subjects were recumbent and measurements were started after at least 5 min rest. Carotid and radial artery pressure waveforms were recorded sequentially (or vice versa) using a validated Millar tonometer26 with applanation technique. There were 439 adult subjects (282 men and 157 women) attending a cardiovascular outpatient clinic. Pressure waveforms were recorded after brachial systolic and diastolic measurements with mercury cuff sphygmomanometer using the Korotkov sound technique and phase 5 for diastolic pressure. Details of age, blood pressure, heart rate, cardiovascular disease, and treatment are given in Tables 12 to 3. All subjects gave informed consent for the procedures.
Descriptive statistics for variables in study cohort of 439 subjects
| Variable | Mean | SD | Range |
|---|---|---|---|
| Age (years) | 58.8 | 16.34 | 17–90 |
| Heart rate (beats/min) | 70.0 | 11.4 | 38–107 |
| Systolic pressure (mm Hg) | 142.3 | 24.1 | 92–228 |
| Diastolic pressure (mm Hg) | 81.8 | 11.9 | 40–120 |
| Variable | Mean | SD | Range |
|---|---|---|---|
| Age (years) | 58.8 | 16.34 | 17–90 |
| Heart rate (beats/min) | 70.0 | 11.4 | 38–107 |
| Systolic pressure (mm Hg) | 142.3 | 24.1 | 92–228 |
| Diastolic pressure (mm Hg) | 81.8 | 11.9 | 40–120 |
Prevalence of cardiovascular disease in the study population
| Classification | Yes | No |
|---|---|---|
| Normal | 83 | 356 |
| Hypertension | 157 | 282 |
| Ischemic heart disease | 229 | 210 |
| Left ventricular failure | 50 | 389 |
| Aortic valvular disease | 10 | 429 |
| Abdominal aortic aneurysm | 8 | 431 |
| Peripheral vascular disease | 21 | 418 |
| Atrial fibrillation | 7 | 432 |
| Cerebrovascular accident | 2 | 437 |
Prevalence of drug therapy in cohort of 439 subjects
| Drug | Yes | No |
|---|---|---|
| Treatment | 300 | 139 |
| -Blockers | 144 | 295 |
| Loop diuretics | 54 | 385 |
| Thiazides | 71 | 368 |
| ACE inhibitors | 87 | 352 |
| Nitrates, short acting | 3 | 436 |
| Nitrates, long acting | 66 | 373 |
| Calcium antagonists | 128 | 311 |
| Digitalis | 47 | 392 |
| Quinidine | 5 | 434 |
| -Antagonists | 9 | 430 |
| Hydralazine | 2 | 437 |
| Aldomet | 2 | 437 |
| Type 1 antiarrhythmic agents | 22 | 417 |
| Amiodarone | 7 | 432 |
ACE = angiotensin converting enzyme.
Analysis
Analogue waveforms were digitized at 128 samples/sec and recorded over a period of 8 sec. Differentials were used to identify the foot of the waveforms, and the series of waves were overlaid and ensemble-averaged to obtain a single wave for the radial or the carotid site. The peak and nadir of the radial waveform were set to sphygmomanometric systolic and diastolic pressure, respectively, for calibration of the whole waveform based on the constant properties of upper limb arteries and the short distance between brachial and radial measurement sites. On the basis of near identity of mean and diastolic pressure in central and peripheral arteries, as they vary relatively little throughout the conduit arterial system,19,28 the carotid mean and diastolic pressure were set as identical to radial mean and diastolic pressures and the carotid systolic pressure obtained by extrapolation.28 Mean arterial pressure was measured as an average of pressure over the total recording time. There were minimal changes in heart rate or other variables during the recording session, so the radial and carotid waveforms were regarded as though recorded simultaneously. Fourier analysis was undertaken on the ensemble-averaged waveforms with calculation of modulus and phase up to 10 Hz.
For determination of transfer function from aorta to radial artery, corresponding harmonic components were related in modulus only. Data points were excluded if modulus calculated from these data exceeded 4.0, the denominator was small, and the calculated value was considered unreliable.29 There were fewer than 20 such data points in the whole series. Phase was not expressed, as digitization was not set to the electrocardiograph.
Statistical method
In the frequency domain, the moduli for each frequency were compared using unpaired two-tail t test, with P values <.05 taken as indicating significant difference.
Validation
We did have the opportunity to test the correspondence of calculated central aortic pressure with the pressure measured directly in the aorta. A data set of 61 simultaneously recorded ascending aortic and radial pressure waveforms obtained from 61 patients scheduled for surgery before (control) and during intravenous infusion of nitroglycerine were analyzed, as previously published.19,21 We also analyzed another data set of 12 simultaneously recorded ascending aortic and radial pressure waveforms obtained from 12 patients scheduled for percutaneous transluminal coronary angioplasty before (control) and after a bolus dose of midazolam 1.0 to 2.0 mg, as previously described.20
Results
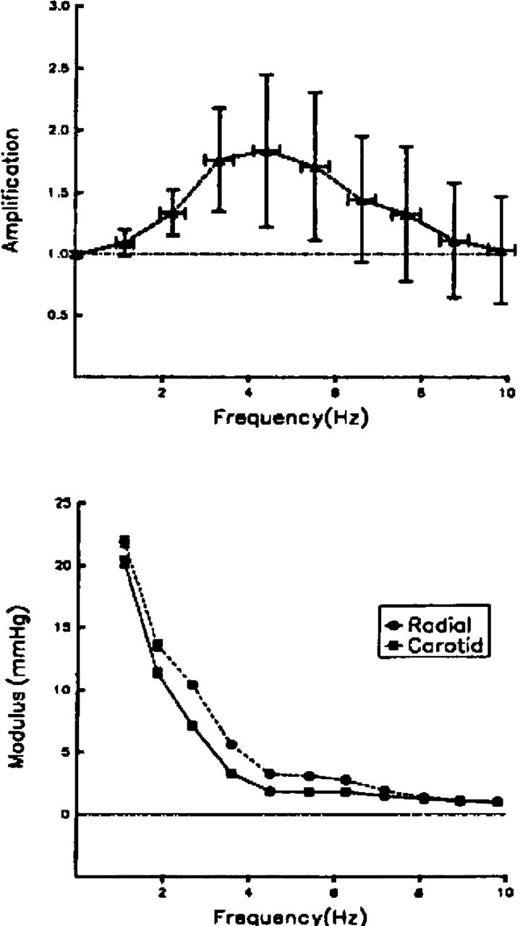
Modulus of transfer function increased up to a peak value of 1.8 between 3 and 6 Hz before falling toward unity at higher frequencies. Data are shown as mean ± standard deviation (Fig. 1). Considerable scatter at high frequencies is attributable to low amplitude of pressure harmonics at these frequencies (Fig. 1). Deviation between radial and carotid pressure moduli was greatest between 3 and 6 Hz and was least at the highest and lowest frequencies.
(Top) Transfer function in the full group of 439 patients. Data expressed as mean ± SD. Because of the large number of subjects (n = 439), the SEM for all values was <0.1 unit. (Bottom) Values of harmonic components from the carotid and radial pressure waves of these subjects. (From Ref. 22).
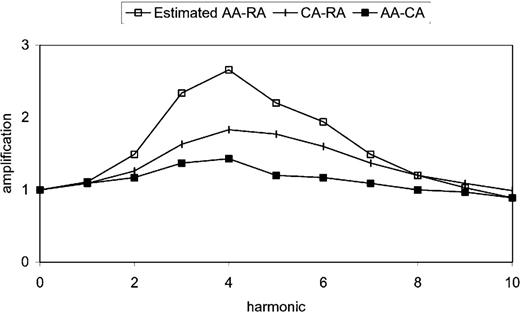
For comparison against invasively determined radial-aortic transfer function, the average values of modulus from Fig. 1 were adjusted, using the transfer function for aortic-carotid pressure amplification. When this was done, the calculated aortic-radial transfer function (Fig. 2, top tracing) was virtually identical to the invasively determined data published by Karamanoglu et al14 and Chen et al16 and up to the frequency of 4 Hz reported by Hope et al.2
Transfer functions of pressure waves in the radial and carotid arteries from the noninvasive study (middle tracing),22 shown together with transfer function of pressure waves between the ascending aorta and carotid artery (bottom tracing), and the ascending aorta-radial artery transfer function calculated from the two sets of data (top tracing). The calculated aorta-radial artery transfer function is very similar to that published by Karamanoglu et al14 and by Chen et al.16 AA-CA = aortic artery-carotid artery; AA-RA = aortic artery-radial artery; CA-RA = carotid artery-radial artery.
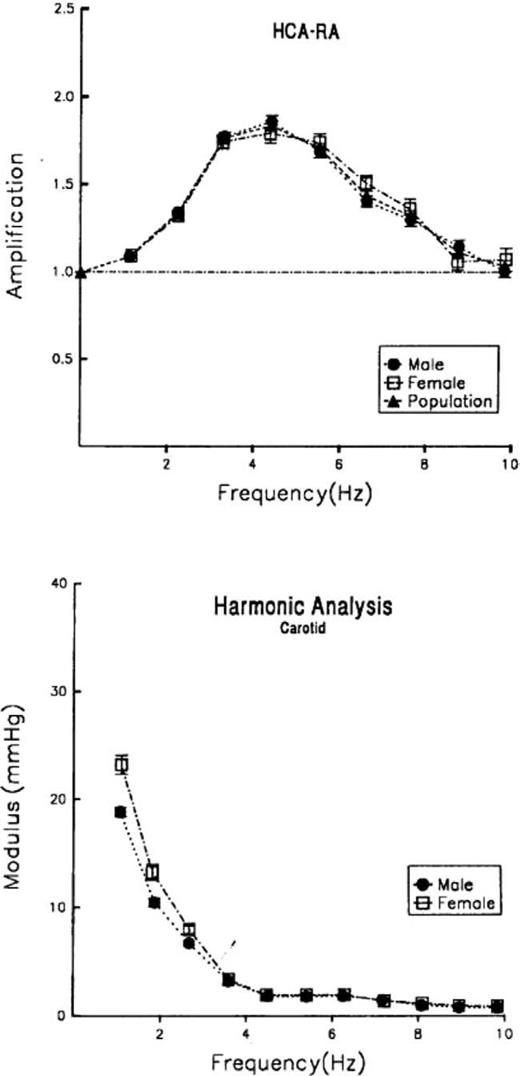
For studying the effects of gender, data from all female subjects were compared against those of male subjects. There were no significant differences in age, pathology, or drug treatment between the two groups. Women, however, tended to have higher systolic and pulse pressure than men. For practical purposes there was no significant difference between male and female subjects (Fig. 3, top). This was a surprise because, with shorter stature and arm length, we expected that women might show some separation (peak amplification at higher frequency), but this was not apparent. However, there was a significant difference between amplitude of the first three harmonics of pressure in the carotid and radial waves (Fig. 3, bottom). This explained the difference in systolic and pulse pressure between the two groups and may have been due to differences in body height, as this influenced wave reflection from the lower body.
(Top) Carotid/radial pressure transfer function plotted for males (•) and females (□). (Bottom) Comparison of carotid harmonic components from fundamental frequency. (From Ref. 22).
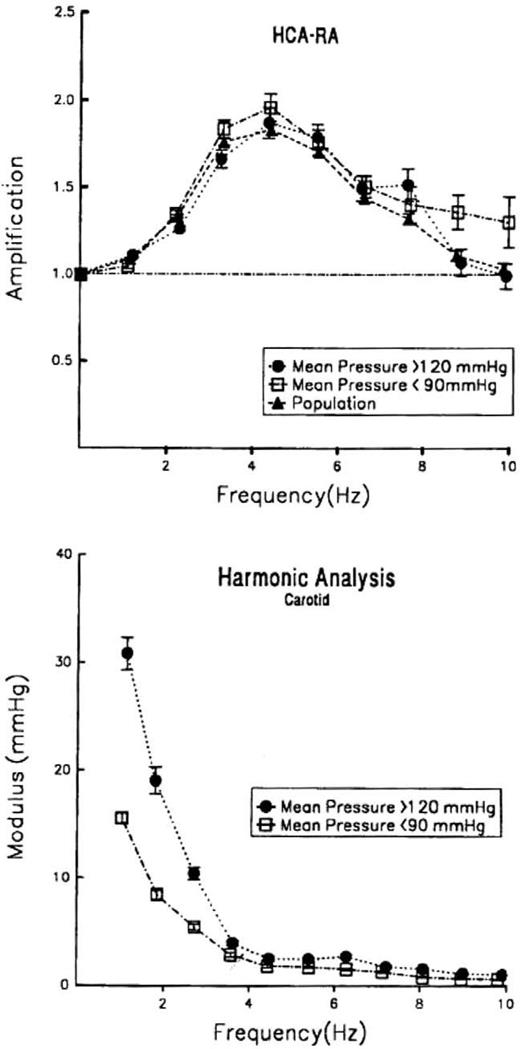
For studying the effects of mean arterial pressure in the upper limb transfer function, we separated subjects into those with mean pressure ≥120 mm Hg and those with mean pressure ≤90 mm Hg as compared with the whole group. Again, and surprisingly, there was little difference in modulus of the transfer function in the upper limb (Fig. 4, top). There was, however, a considerable difference in amplitude of the carotid pressure harmonics of those with high and low pressure (Fig. 4, bottom); this is readily explained on the basis of increased aortic impedance, aortic stiffening, and early wave reflection from the lower body in persons with the higher mean pressure.
Top) Carotid/radial pressure transfer function plotted for whole study population (▴), mean pressure >120 mm Hg (•), and mean pressure <90 mm Hg (□). (Bottom) Comparison of carotid harmonic components from fundamental frequency. HCA-RA = harmonics of carotid artery-radial artery. (From Ref. 22).
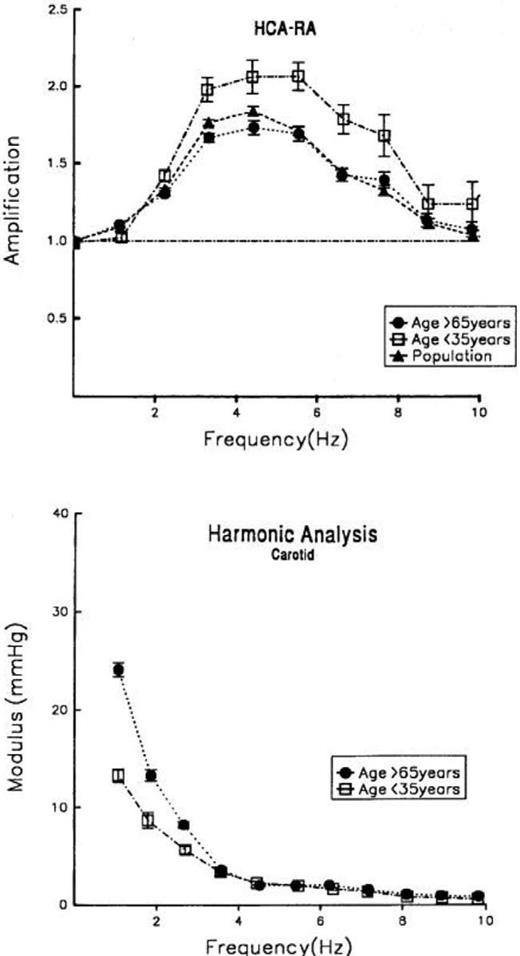
For studying the effects of age, we separated the population into those individuals ≥65 years, those ≤35 years, and the whole population (Fig. 5). There was an obvious difference between the youngest and older subjects that was readily apparent only at values >3 Hz. As for gender and arterial pressure, there were large differences in amplitude of the carotid harmonics up to 3 Hz. There were no differences above 3 Hz in amplitude of carotid harmonics.
(Top) Carotid/radial pressure transfer function plotted for whole study population (▴), for age group >65 years (•), and for age group <35 years (□). (Bottom) Comparison of carotid harmonic components from fundamental frequency. HCA-RA = harmonics of carotid artery-radial artery. (From Ref. 22).
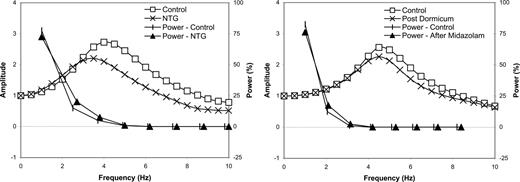
If a generalized transfer function is to be used in any individual under different conditions, it must be established through validation studies such that central aortic pressure calculations correspond within accepted limits to the pressure measured directly in the central aorta, irrespective of age, gender, blood pressure, heart rate, disease, and drug therapy—or that any nonconformity be specified. Such data have been published and accepted by the Food and Drug Administration (FDA).19,21 These data are given in Fig. 6 (left). As for the noninvasively determined radial-carotid transfer function, findings under control conditions were virtually identical to those previously published, although the interventions were associated with a definite but small difference in modulus of amplification. However, as with the noninvasive carotid data, such differences were only apparent at the higher frequencies where amplitude of the initial waveform harmonics were very low. These data are presented together with transfer function data determined by us from another study,20 where high fidelity manometry was used (Fig. 6, right). Again there is correspondence with the values up to 4.0 Hz with some divergence at higher frequencies at which harmonic moduli were small.
(Left) Analysis of a data set of 61 simultaneously recorded ascending aortic and radial pressure waveforms before (control) and during intravenous infusion of nitroglycerine (NTG). Transfer function amplitude at baseline (control) and during infusion of NTG is given on the left vertical axis. Energy or power content (in %) at each harmonic frequency up to 10 Hz is given on the right axis. There was a close correspondence of transfer function over the frequency range that contained most of the energy of the pressure waveforms (0 to 3.3 Hz); more than 98% of the energy was contained over this frequency range. Above the frequency range at which deviation of transfer function was considerable (3.3 to 10 Hz), amplitude of pressure components was very low, with less than 2.0% of total energy. (Data collected by A. Pauca and N. Kon and analyzed by A. Qasem and M. O’Rourke.) (Right) Analysis of a data set of 12 simultaneously recorded ascending aortic and radial pressure waveforms before (control) and after a bolus dose of midazolam 1.0 to 2.0 mg. There was little difference in transfer function up to 3.0 Hz. Amplitude of pressure harmonics was very low over 3.0 Hz, at which point the transfer function curves diverged. (Data collected by S. Soderstrom, J. Sellgren, J. Ponten, and G. Nyberg and analyzed by A. Qasem and M. O’Rourke.)
Discussion
The assumption of linearity in pressure/pressure and pressure/flow relationships underlies the use of all transfer functions, where their relationship is expressed in the frequency domain, as modulus and phase plotted against frequency. In expressing the relationship between mean pressure and mean flow as resistance, this assumption is likewise implied. Use of transfer functions was initially championed by the English physiologist Donald McDonald in the mid-1950s,6,7 and was based on the theoretic studies of the mathematician John Womersley,5 who examined the Navier-Stokes equations as these apply in the arterial tree. Womersley concluded that nonlinearities, although present, were sufficiently small in comparison with measuring errors to be neglected “to a first approximation.” While justifying McDonald’s early approach, the views gained further confirmation from the work of McDonald’s protégé, Michael Taylor, who popularized the concept of vascular impedance through detailed physiologic and theoretical studies.11,30,31 By 1980, opposition to this basic concept had evaporated. The field was advanced by Murgo et al29 when new accurate manometers and flow meters were introduced for clinical and experimental studies.32 Development of accurate tonometers for noninvasive measurement of the arterial pressure waveform26,33,34 opened another field for use of transfer functions to describe the relationship between upper limb (brachial or radial) and central (aortic or carotid) waveforms.
It had long been known that there are substantial differences in amplitude and contour between aortic and upper limb pressure waves; under conditions such as exercise, the difference in systolic pressure was as much as 80 mm Hg.12,35,36 Hence, use of transfer functions or other processes to correct for such distortion assumed an important priority in human physiologic and clinical research.13
Transfer functions for pressure waves in the upper limb were first used by O’Rourke37 to attempt separation of cardiac and vascular factors in the interpretation of brachial pressure values. The next report was by Lasance et al38 in the Netherlands, with the objective of gaining more accurate measurements of pressure in arteries in which it had most physiologic (and clinical) relevance. Neither of the papers studied the effect of interventions, though both showed similarities within a group of patients. To be really useful, a transfer function must be sufficiently stable during various interventions that central pressure can be determined accurately during the intervention. The important clue that transfer function might be stable came from the observation that nitroglycerine caused similar changes in central and brachial artery waveforms.39 This concept was solidified by the finding in a small group of patients studied at cardiac catheterization and the observation that the brachial/aortic and radial/aortic transfer functions were similar before and after use of nitroglycerine.14 The same study also examined published data collected during exercise and various physiologic maneuvers35,36 and confirmed (relative) stability of the central-upper limb pressure transfer function. Realistic modeling studies15 provided further support.
It is not possible, through studies at cardiac catheterization, to test all variables that may affect the transfer function for pressure in the upper limb. Individuals undergo this procedure only when there is suspicion of disease and so cannot be considered as normal. There are problems with using conventional fluid-filled catheter manometer systems in that these are difficult to purge of bubbles and frequency response is rarely adequate.1,3,7,12,19 There are problems also in use of catheter-tip manometers, as their substitution for routine catheters prolongs the procedure (especially when an intervention is undertaken) and as they are expensive and are recommended only for single use. These restrictions led to the study of carotid-radial transfer functions as a surrogate of ascending aortic-radial. Data support use of the generalized transfer functions as used by us and by others, and show that the same generalized transfer function can reasonably be used in male and female individuals, at different arterial pressures, and in mature adults (Figs. 34 to 5). Data presented in Fig. 6 show a close correspondence of transfer function over the frequency range that contained most of the energy of the pressure waveforms (0.0 to 3.3 Hz), with more than 98% of the energy contained over this frequency range. Above the frequency range at which deviation of transfer function was considerable, amplitude of pressure components was very low, with less than 2% of total energy.
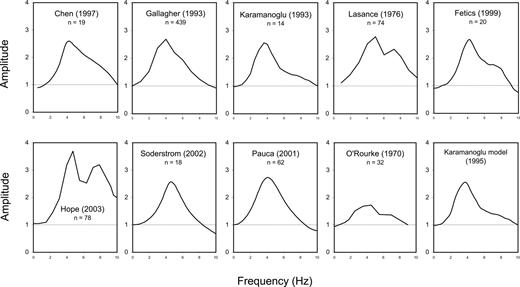
Data on transfer functions under control conditions from all published studies are shown in Fig. 7. Aorta-radial transfer functions were found to be similar in eight of ten studies. The dissimilarity of the other two transfer functions can be explained; low peak amplitude in the study by O’Rourke37 is attributable to measurement of peripheral pressure in the mid-proximal brachial artery, and the high amplitude after the peak in the study by Hope et al2 is attributable to low natural frequency and damping of the fluid-filled manometer system used for recording. In the eight other studies, there is good correspondence over the frequency range required (0.0 to 10.0 Hz) to identify systolic shoulder and systolic augmentation.
Composite figure showing upper limb transfer function modulus from Lasance et al,38 Karamanoglu et al,14,15 Gallagher,22 Chen et al,16 Fetics et al,17 O’Rourke,37 Hope et al,2 and from data provided by Soderstrom et al20 and Pauca et al.19 Low peak amplitude in the study by O’Rourke37 is attributable to measurement of central pressure in the aortic arch and distal pressure in the mid-proximal brachial artery. High amplitude after the peak in the study by Hope et al2 is attributable to low natural frequency, and damping of the fluid-filled manometer system used to record aortic pressure.
Generation of aortic pressure from upper limb pressure waveforms is a desirable goal, even if there is scant information available regarding clinical implications. What data exist show that values of central pressure are related to outcomes and more precisely related to outcomes than peripheral pressure values (Table 440,,,–44 and Table 545,,,,,–51). On a theoretic basis, this is what one would predict, as blood pressure-related complications occur in central arteries, not the upper limb. In comparison, left ventricular pressure during systole is almost exactly the same as that in the aorta, not the brachial artery, and the coronary perfusion pressure head is represented by the aortic pressure maintained during diastole.12
Relationship between outcomes and noninvasively measured aortic or central pulse pressure
| Authors (Ref.) | Study Finding |
|---|---|
| Waddell et al40 | Predictor of coronary atherosclerosis |
| Safar et al41 | All-cause and cardiovascular disease-related mortality |
| Boutouyrie et al42 | Carotid artery intima-media thickness* |
| Boutouyrie et al43 | Regression with therapy dependent on change in carotid pulse pressure* |
| Boutouyrie et al44 | Primary coronary events* |
Specifically noted, no relation to brachial blood pressure.
Relationship between outcomes and directly measured aortic pressure
| Authors (Ref.) | Study Finding |
|---|---|
| Pulse pressure | |
| Lu et al45 | Restenosis after coronary angioplasty, OR = 5.9 for pulse pressure >66 mm Hg |
| Nishijima et al46 | Severity of coronary disease* |
| Chemla et al47 | Relation to concentric left ventricular hypertrophy |
| Philippe F et al48 | Extent of coronary disease* |
| Nakayama et al49 | Restenosis after coronary angioplasty |
| Augmentation index | |
| Hayashi et al50 | Severity of coronary disease, OR = 16.2 |
| Ueda et al51 | Restenosis after coronary angioplasty |
OR = odds ratio.
A few cautionary notes are in order here. The transfer function process must be, and is, an approximation. The arterial tree is not exactly the same in all persons with all diseases at all ages and with all drug therapies, but it is basically similar. It is well known that atherosclerosis does not affect upper limb vessels in the same way as it affects central (carotid, cerebral, coronary) arteries and the aorta. Aging has little or no effect on stiffness of and wave velocity in the brachial artery and its radicles12,52–55; change in blood pressure also has little effect.56 As shown here (Fig. 6) and reported earlier,14,15 drug therapies do affect the transfer function but at frequencies at which harmonic components of the waveform are low. Given these basic similarities under different conditions, it is natural that one should try to exploit relative constancy of transfer functions in the upper limb. In so doing, one is at least advancing on previous views that central and peripheral systolic and pulse pressure were identical and that amplitude of transfer function remains at 1.0 at all frequencies. However, one must recognize the fact that the transfer function is not exactly constant under all conditions.
Use of the transfer function technique for generating the central pressure waveform has created the same controversy as did the same process for describing pressure/flow relationships as impedance in the 1950s. Although the latter approach is now generally accepted, it must be emphasized that both need be qualified with the words used by Taylor, McDonald, and Womersley … “to a first approximation.”6
Surprisingly, much of the criticism of the transfer function process relates to inaccuracies of the sphygmomanometer cuff in measurement of systolic (peak) and diastolic (nadir) pressure in the upper limb. This is an irrelevant and entirely separate issue. A transfer function process relates to waveforms. It cannot correct for errors of other methods used for calibration. Such errors affect all interpretations that follow from use of the conventional cuff sphygmomanometer.1,57
In conclusion, determination of central pressure is a new concept, and while theoretically attractive, has little clinical backing to support its usefulness. What data exist indicate that it is superior to conventional measures of upper limb pressure41–51,58 and that use of the cuff sphygmomanometer can be complemented by determination of the pressure pulse waveform in the upper limb.
References
1.
2.
3.
4.
5.
6.
8.
9.
11.
12.
13.
14.
15.
16.
17.
18.
19.
20.
21.
22.
23.
24.
25.
26.
27.
28.
29.
30.
31.
32.
33.
34.
35.
36.
37.
38.
39.
40.
41.
42.
43.
44.
45.
46.
47.
48.
49.
50.
51.
52.
53.
54.
55.
56.
57.
58.
