


Hypertension is the most prevalent chronic disease worldwide. Lifestyle behaviors for its prevention and control are recommended within worldwide guidelines. Nevertheless, their combined relationship with blood pressure (BP) level, particularly in the general population, would need more investigations. Our aim in this study was to evaluate the relative impact of lifestyle and nutritional factors on BP level.
Cross-sectional analyses were performed using data from 8,670 volunteers from the NutriNet-Santé Study, an ongoing French web-based cohort study. Dietary intakes were assessed using three 24-hour records. Information on lifestyle factors was collected using questionnaires and 3 BP measurements following a standardized protocol. Age-adjusted associations and then multivariate associations between systolic BP (SBP) and lifestyle behaviors were estimated using multiple linear regressions.
SBP was higher in participants with elevated body mass indices (BMIs). Salt intake was positively associated with SBP in men but not in women. The negative relationship between consumption of fruits and vegetables and SBP was significant in both sexes. Alcohol intake was positively associated with SBP in both sexes; physical activity was not. The 5 parameters representing the well-accepted modifiable factors for hypertension reduction plus age and education level, accounted for 19.7% of the SBP variance in women and 12.8% in men. Considering their squared partial correlation coefficient, age and BMI were the most important parameters relating to SBP level. Salt intake was not associated with SBP in either sex after multiple adjustments.
BMI was the main contributory modifiable factor of BP level after multiple adjustments.
Hypertension is the most prevalent chronic disease, affecting more than 30% of adults aged ≥25 years worldwide.1 Complications of hypertension account for 9.4 million deaths every year. In France, its estimated prevalence is 31% for adults aged 18–74 years.2 Furthermore, most epidemiological studies have shown that among people with treated hypertension, only a minority have blood pressure (BP) in the desired range.2 With such an increasing prevalence of hypertension and the difficulty in managing it, strategies are required to prevent its incidence. Hypertension has a multifactorial origin that includes genetic and behavioral factors. Different lifestyle behaviors have been shown to be associated with the prevalence of hypertension.3 On this basis, the following 5 nonpharmacological measures are usually recommended within worldwide guidelines, with the aim of preventing and improving the risk of complications related to high BP4–6: maintaining or attaining a normal weight, that is, a body mass index (BMI) of <25kg/m2; increasing physical activity; limiting alcohol consumption to 2 drinks a day for men and 1 drink a day for women; controlling dietary salt intake at 6g/day; and having a dietary approach to stop hypertension (DASH), that is, a diet rich in fruits, vegetables, and low-fat dairy products and reduced in saturated and total fat.7,8 However, it appears to be difficult to implement and maintain these lifestyle behaviors in daily life; some research suggests that their combination has a subadditive effect on BP reduction.9
In addition to these 5 recommended measures, several other nutritional factors including intake of fiber, magnesium, phosphorus, and calcium may affect BP. However, findings from controlled trials have shown a modest, inconsistent effect on BP level.
Nutritional policies have been implemented in several countries for hypertension prevention in the general population. In France, the prevention of high BP through nutrition is one objective of the French Nutrition and Health Program (Programme National Nutrition Santé) launched in 2001 by the French Ministry of Health.10 However, lifestyle changes are recommended for patients at each BP level and with each risk level, while few data are available in this field, particularly in untreated populations.
Our aim in this study was to evaluate and quantify the association between an individual’s characteristics, modifiable lifestyle behaviors (in particular, dietary intake), and BP among a general population of untreated French adults. A second goal was to quantify the extent to which the recommended lifestyle factors were determinants of BP level in order to promote their individual or general implementation.
METHODS
Study design
The NutriNet-Santé cohort Study is an ongoing French web-based study. Details concerning study protocol, design, and methods have been detailed elsewhere.11 Briefly, the NutriNet-Santé Study was implemented in a general population, targeting Internet-using adult volunteers aged ≥18 years. Launched in May 2009, the study is planned for a scheduled follow-up of 10 years. Using a dedicated website, participants were asked to complete questionnaires at baseline and every year thereafter. The baseline and annual questionnaires provide information on sociodemographics, lifestyle characteristics, health status, medication use, physical activity, and diet. In addition to the web study, a subsample of volunteer participants was asked to visit a local consultation center (60 sites disseminated throughout France) where blood samples are collected and clinical examinations performed. All participants signed an informed consent form. The International Research Board of the French Institute for Health and Medical Research (0000388FWA00005831) and the Comité National Informatique et Liberté (CNIL; 908450 and 909216) approved the NutriNet-Santé Study. The Consultation Committee for the Protection of Participants in Biomedical Research (C09-42; 5 May 2010) and the CNIL (1460707) approved the collection of biological samples and clinical data.
The ancillary study is a cross-sectional analysis using data from the NutriNet-Santé Study, which was carried out in the subsample of volunteers who took part in a consultation between January 2010 and February 2013.
Study population
The eligible population included volunteer participants from the NutriNet-Santé cohort who underwent a clinical examination after exclusion of pregnant women and participants who reported taking vasoactive treatment (antihypertensive medication or α (1)-adrenergic receptor for benign prostatic hyperplasia treatment). Volunteers who reported being hypertensive but not taking any antihypertensive drugs were not excluded. To include participants in analyses, the dietary questionnaire they completed prior to the visit had to be validated (see details below).
A total of 14,191 volunteers underwent a clinical consultation between January 2010 and February 2013. After exclusion of pregnant women and participants treated with vasoactive drugs, 11,739 were eligible. Of them, both dietary data and valid BP and anthropometric measurements were available for 8,670 participants who were included in analyses (Figure 1).
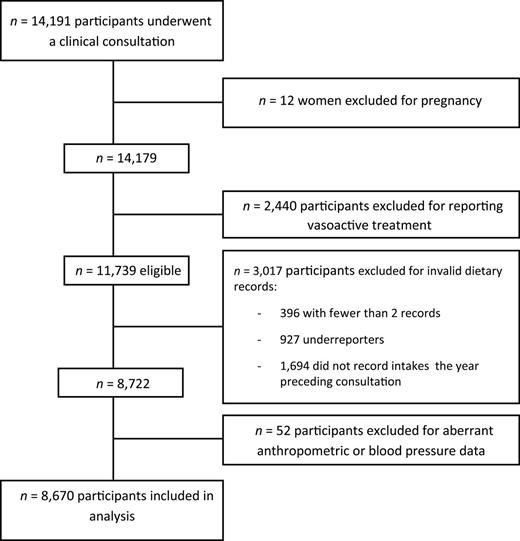
Selection of study’s population (flow chart).
Data collection and treatment
Dietary intake assessment.
At inclusion and on a yearly basis, participants completed three 24-hour dietary records on 3 randomly selected days using a user-friendly web interface; this collection method has been validated.12 For the present study, dietary data from the nutritional assessment preceding the clinical visit were used. Daily dietary intake was calculated as the weighted average of at least 2 records (a weighting coefficient was used to take into account intraindividual variability of weekdays vs. weekend days). Nutrient intakes were estimated using the NutriNet-Santé food composition table, which includes more than 2,000 food items. Composite dishes were divided and categorized into food groups using French recipes. Participants with fewer than 2 valid records were excluded. A record was considered not valid if underreporting was detected regarding a participant’s weight and height according to the method developed by Black.13 Total energy intake was calculated with and without energy from alcohol intake. Mineral intake, that is, sodium, potassium, calcium, magnesium, and phosphorus, was calculated in milligrams per day. Dietary questionnaires provided sodium intake from foods. Salt consumption was reported by multiplying sodium consumption by 2.54. Moreover, in order to take into account addition of salt during cooking and eating, 1.5g of salt per day was added to estimated total salt consumption as advised by a French nutrition agency.14 Macronutrients were reported in percentage of total energy intake (without alcohol). Dietary questionnaires covered alcohol consumption, which was reported in grams of ethanol per day.
Demographic, health, and lifestyle data collection.
Demographic, health, and lifestyle data were collected at baseline and yearly thereafter using web-based questionnaires. Data from the survey prior to the clinical visit were used for the present analyses. Self-administrated questionnaires provided data on educational level, occupation, vasoactive medication use, pregnancy, and smoking status. Physical activity and sedentary behaviors were reported with a web version of the International Physical Activity Questionnaire in its short form (IPAQ-sf).15 This tool allows estimating either with 3 levels of physical activity, that is, low, medium, and high, or with weekly energy expenditure, expressed in metabolic equivalent (MET) * minute/week as a continuous variable. Sedentary lifestyle was estimated by daily time spent in front of a screen (television, computer, or game play).
Anthropometrics and blood pressure measurement.
Anthropometrics and BP measurements were taken during the medical visit by trained technicians using standardized protocol. Systolic BP (SBP) and diastolic BP (DBP) were measured 3 times at 1-minute intervals in a seated position after 5 minutes of rest and using an automatic validated device (OMRON HEM-7015IT, Rosny-sous-Bois, France). The average of the 3 measurements was used for the analyses. An SBP value >180mm Hg or <90mm Hg and a DBP value >120mm Hg or <50mm Hg were considered to be outliers and were eliminated. Participants with fewer than 2 valid measurements were excluded. Pulse pressure (PP = SBP − DBP) and mean arterial pressure (MAP = 2/3 * DPB + 1/3 * SBP) were calculated according to the usual formula.
Weight measurement was performed with an electronic scale with participants wearing only underwear. Height was measured with a wall-mounted measuring rod. BMI was calculated by dividing weight, in kilograms, by height, in square meters, and reported as a continuous variable.
Statistical analysis
Descriptive analyses are reported as means ± standard deviation (SD) for quantitative variables or frequency and percentage for categorical variables for the entire population and for each gender. Student t test and χ2 test were used to compare variables for males and females. Crude relationships between BP parameters, specific preselected nutrients, and the other covariates of interest were calculated using the Pearson correlation coefficient. Age-adjusted relations were also performed using linear regression models to assess the association between covariables of interest and BP parameters that provide regression coefficients (β). Additional adjustments with total energy intake were performed.
To investigate determinants of BP, we used a multiple linear regression for each gender. Model-evaluated parameters included age; BMI; and consumption of alcohol, salt, and fruits and vegetables as continuous variables; physical activity level and education level were categorical variables. Results reported for each model were the adjusted coefficient of determination, R2, and the squared partial correlation coefficient, r2, which were used to describe the contribution to BP variability for each parameter. Regression diagnostics were assessed by checking homoscedasticity and normality of the residuals; multicollinearity was checked using the variance inflation factor.
All tests were 2-sided; P < 0.05 was considered statistically significant. Statistical analyses were performed using SAS software (version 9.2; SAS Institute, Cary, NC).
RESULTS
Participant characteristics and dietary intakes of those included are given in Table 1.
Characteristics of the study population
| Characteristic | All | Men | Women | P value |
|---|---|---|---|---|
| n (%) | 8,670 (100) | 2,075 (24) | 6,595 (76) | <0.0001 |
| Age (years) | 50.9±13.6 | 53.5±14 | 50.1±13.3 | <0.0001 |
| Occupation | ||||
| Unemployed/other | 1,342 (15.5) | 192 (9.3) | 1,150 (17.4) | <0.0001 |
| Retired | 2,400 (27.7) | 805 (38.8) | 1,595 (24.2) | |
| Self-employed farmer | 18 (0.2) | 3 (0.1) | 15 (0.2) | |
| Entrepreneur | 121 (1.4) | 41 (2) | 80 (1.2) | |
| Manual worker | 56 (0.7) | 29 (1.4) | 27 (0.4) | |
| Manager | 2,202 (25.4) | 617 (29.8) | 1,585 (24) | |
| Employee | 1,051 (12) | 132 (6.4) | 912 (13.8) | |
| Intermediate professional | 1,487 (17.2) | 256 (12.3) | 1,231 (18.6) | |
| Education level | ||||
| Primary | 253 (2.9) | 74 (3.6) | 179 (2.7) | 0.0051 |
| High school | 2,562 (29.6) | 660 (31.8) | 1,902 (28.8) | |
| University or equivalent | 5,855 (67.5) | 1,341 (64.6) | 4,514 (68.5) | |
| Body mass index (kg/m2) | 23.8±4.1 | 24.7±3.4 | 23.5±4.2 | <0.0001 |
| Systolic blood pressure (mm Hg) | 123.5±15.2 | 131.8±14.3 | 120.9±14.6 | <0.0001 |
| Diastolic blood pressure (mm Hg) | 75.2±9.2 | 78.3±9.2 | 74.1±8.9 | <0.0001 |
| Pulse pressure (mm Hg) | 48.4±10.3 | 53.4±9.9 | 46.8±9.9 | <0.0001 |
| Mean arterial pressure (mm Hg) | 91.3±10.5 | 96.2±10.2 | 89.7±10.1 | <0.0001 |
| Alcohol intake (g/day) | 9.1±12.6 | 15.3±16.8 | 7.2±10.4 | <0.0001 |
| Smoking status | ||||
| Never | 4,437 (51.2) | 878 (42.3) | 3,359 (54.0) | <0.0001 |
| Former | 3,277 (37.8) | 951 (45.8) | 2,326 (35.3) | |
| Current | 956 (11.0) | 246 (11.9) | 710 (10.8) | |
| Physical activitya | ||||
| Low | 1,524 (17.6) | 318 (15.3) | 3,359 (54.0) | <0.0001 |
| Medium | 3,549 (40.9) | 734 (35.4) | 2,326 (35.3) | |
| High | 2,964 (34.2) | 898 (43.2) | 710 (10.8) | |
| Continuous variable (metabolic equivalent*min/week) | 2,960,± 2744 | 3,466±2,976 | 2,797±2,645 | |
| Sedentarya,b (min/day) | 364±189 | 372±195 | 361±187 | <0.0001 |
| Dietary intake | ||||
| Total energy intakec (kcal/day) | 1,890±494 | 2,241±523 | 1,780±429 | <0.0001 |
| Fruits and vegetables (g/day) | 430±238 | 448±264 | 424±229 | <0.0001 |
| Milk products (g/day) | 205±158 | 223±173 | 199±153 | <0.0001 |
| Fiber (g/day) | 21±8 | 24±9 | 21±7 | <0.0001 |
| Starch (g/day) | 229±113 | 298±136 | 208±95 | <0.0001 |
| Salt (g/day) | 8.2±2.3 | 9.6±2.7 | 7.8±2.0 | <0.0001 |
| Total fat (%EI c) | 39±7 | 39±7 | 40±7 | <0.0001 |
| Proteins (%EI c) | 17±4 | 17±4 | 17±4 | <0.0001 |
| Total carbohydrate (%EI c) | 43±7 | 44±7 | 43±7 | <0.0001 |
| Potassium (mg/day) | 3,186±881 | 3,592±939 | 3,059±821 | <0.0001 |
| Calcium (mg/day) | 960±325 | 1,079±360 | 922±303 | <0.0001 |
| Phosphorus (mg/day) | 1,315±379 | 1,507±395 | 1,255±353 | <0.0001 |
| Magnesium (mg/day) | 365±126 | 415±138 | 349±117 | <0.0001 |
Data are mean ± standard deviation for quantitative variables or frequency (percent) for categorical variables.
Abbreviation: EI, energy intake.
a Data were available for n = 8,037 for physical activity and n = 8,331 for being sedentary.
b Sedentary corresponds to the time spent in front of a screen.
c Total energy intake without alcohol.
A total of 3,017 participants with no clinically different characteristics were excluded for invalid dietary records, including 813 (27%) men and 2,204 (73%) women. Mean ± SD age was 50.3±13.8 years. Mean ± SD BMI was 24.5±4.5kg/m2. Mean ± SD SBP was 124.6±15.5mm Hg. Smokers represented 13.6% of participants. Education level was high, with 63.7% having a superior educational level (data not tabulated).
Of the 8,670 volunteers, 84 (4%) men and 229 (3.5%) women reported being hypertensive (without hypertensive drug use). Regarding BP measurements, 586 (28.2%) men and 775 (11.8%) women were hypertensive, that is, SBP ≥140mm Hg and/or DBP ≥90mm Hg. Globally, salt consumption was higher in hypertensive participants compared with those who were nonhypertensive (mean ± SD: 8.7±2.6g/day vs. 8.1±2.3g/day, respectively; P < 0.0001). Hypertensive participants displayed higher BMI (mean ± SD: 25.8±4.4kg/m2) than those who were normotensive (23.4±3.9kg/m2; P < 0.0001) and they were more active (3,663±3,228 MET*min/day vs. 2,828±2,623 MET*min/day; P < 0.0001; data not tabulated).
The age-adjusted associations between SBP and lifestyle recommended behaviors are shown in Table 2. The relationships with other BP parameters (DBP, PP, MAP) were not reported because they did not add more information and because SBP is the more important BP parameter associated with hypertension complications.16 The relationship between BMI and SBP level was strong in both sexes, with a SBP level increase of approximately 1mm Hg for a 1-kg/m2 change in BMI. Salt intake was positively associated with SBP in men but not in women (results were similar using sodium intake from foods). Further adjustments of total energy intake (without alcohol) did not modify the results. The negative relationship between consumption of fruits and vegetables was significant in both sexes (β = −0.003, P = 0.01 in men; β = −0.004, P < 0.0001 in women). SBP increased significantly with the dietary sodium–potassium ratio in both sexes. Alcohol consumption was positively associated with SBP in both sexes (β = 0.05, P = 0.01 in men; β = 0.06, P = 0.0004 in women). Physical activity level and being sedentary were not associated with SBP.
Age-adjusted associations between systolic blood pressure and lifestyle recommendations in women and men
| Lifestyle recommendation parameter | Systolic blood pressure | |
|---|---|---|
| β (standard error) | P value | |
| Women | ||
| Salt (g/day) | 0.0001 (0.0001) | 0.08 |
| Potassium intake (mg/day) | –0.001 (0.0002) | 0.01 |
| Sodium-to-potassium ratio | 2.3 (0.61) | 0.0001 |
| Alcohol intake (g/day) | 0.058 (0.016) | 0.0004 |
| BMI (kg/m2) | 0.88 (0.04) | <0.0001 |
| Fruits and vegetables intake (g/day) | –0.004 (0.0008) | <0.0001 |
| Physical activity | 0.17 | |
| Mediuma | –0.59 (0.47) | 0.21 |
| Higha | 0.10 (0.50) | 0.84 |
| Sedentary (min/day) | –0.001 (0.001) | 0.53 |
| Men | ||
| Salt (g/day) | 0.0003 (0.0001) | 0.01 |
| Potassium intake (mg/day) | 0.0002 (0.0003) | 0.64 |
| Sodium-to-potassium ratio | 2.1 (1.03) | 0.05 |
| Alcohol intake (g/day) | 0.051 (0.018) | 0.006 |
| BMI (kg/m2) | 1 (0.90) | <0.0001 |
| Fruits and vegetables intake (g/day) | –0.0030 (0.0012) | 0.01 |
| Physical activity | 0.31 | |
| Mediuma | –1.19 (0.93) | 0.20 |
| Higha | –0.28 (0.91) | 0.75 |
| Sedentary (min/day) | –0.002 (0.002) | 0.18 |
Abbreviation: BMI, body mass index.
aReference: physical activity = low.
The age-adjusted associations between SBP and other nutritional factors are shown in Table 3. Fiber intake was negatively and significantly associated with SBP in both sexes (β = −0.08, P = 0.02 in men; β = −0.12, P < 0.0001 in women). A significant negative association was found between magnesium intake and SBP in women but not in men. A significant positive association was found between protein intake and SBP in men but not in women. There was no significant association between SBP and total energy intake (without alcohol), dairy product consumption, starch consumption, total fat and carbohydrate intake, and calcium and phosphorus intake in both sexes.
Age-adjusted associations between systolic blood pressure and other dietary, lifestyle, and socioeconomic characteristics in women and men
| Characteristic | Systolic blood pressure | |
|---|---|---|
| β (standard error) | P value | |
| Women | ||
| Smoking statusa | –1.58 (0.55) | 0.004 |
| Education level | <0.0001 | |
| Secondaryb | –3.09 (1.07) | 0.004 |
| Universityb | –5.4 (1.05) | <0.0001 |
| Dietary intake | ||
| Total energy intakec (kcal/day) | 0.001 (0.0004) | 0.09 |
| Dairy products (g/day) | –0.002 (0.001) | 0.11 |
| Fiber (g/day) | –0.12 (0.02) | <0.0001 |
| Starch (g/day) | –0.002 (0.002) | 0.27 |
| Total fat (%EI) | 1.3 (2.5) | 0.61 |
| Proteins (%EI) | 3.3 (4.3) | 0.44 |
| Total carbohydrate (%EI) | –2.2 (2.4) | 0.37 |
| Calcium (mg/day) | –0.0001 (0.001) | 0.92 |
| Phosphorus (mg/day) | 0.00002 (0.001) | 0.97 |
| Magnesium (mg/day) | –0.004 (0.001) | 0.002 |
| Men | ||
| Smoking statusa | –0.95 (0.95) | 0.32 |
| Education level | 0.01 | |
| Secondaryb | 3.97 (1.69) | 0.02 |
| Universityb | 2.35 (1.66) | 0.16 |
| Dietary intake | ||
| Total energy intakec (kcal/day) | 0.0006 (0.0006) | 0.34 |
| Dairy products (g/day) | 0.001 (0.002) | 0.46 |
| Fiber (g/day) | –0.08 (0.03) | 0.02 |
| Starch (g/day) | –0.0002 (0.002) | 0.91 |
| Total fat (%EI) | 3.2 (4.6) | 0.49 |
| Proteins (%EI) | 19.7 (0.02) | 0.021 |
| Total carbohydrate (%EI) | –7.9 (4.3) | 0.07 |
| Calcium (mg/day) | 0.001 (0.001) | 0.14 |
| Phosphorus (mg/day) | 0.001 (0.001) | 0.28 |
| Magnesium (mg/day) | –0.001 (0.002) | 0.53 |
a Former smokers were considered to be nonsmokers.
b Reference: education level = primary.
c Total energy intake without alcohol.
Results of multiple linear regression models are shown in Table 4. The 5 parameters representing the classic lifestyle recommendations for reducing hypertension (BMI, alcohol consumption, physical activity, intake of salt, and intake of fruits and vegetables), when added to age and education level, accounted for 19.7% of the SBP variance in women and 12.8% in men. Age and BMI were the most strongly associated with SBP (squared partial correlation coefficient r2 = 8.6% for age and r2 = 6.8% for BMI in women; r2 = 4.1% for age and r2 = 5.1% for BMI in men). Salt intake was not associated with SBP in either sex after multiple adjustments (results were similar using sodium intake from foods). Consumption of fruits and vegetables as well as alcohol remained associated with SBP in women but not in men. Medium vs. low physical activity was not associated with SBP level; unexpectedly, high vs. low physical activity was found to be positively associated with SBP in women. Further adjustment of total energy intake (without alcohol) did not modify the results. Use of waist circumference (WC) instead of BMI in the model provided similar results (squared partial correlation coefficient r2 = 6.2% for WC in women and r2 = 4.1% for WC in men).
Multivariate association between lifestyle factors and systolic blood pressure in women and men
| Model | Adjusted R2 (%) | P value | |
|---|---|---|---|
| 19.7 | <0.0001 | ||
| Parameters | Partial r2 (%) | β (standard error) | P value |
| Women | |||
| Age | 8.6 | 0.33 (0.01) | <0.0001 |
| BMI | 6.8 | 0.87 (0.04) | <0.0001 |
| Alcohol intake | 0.2 | 0.05 (0.02) | 0.002 |
| Physical activity | 0.3 | 0.008 | |
| Physical activity medium vs. low | 0.40 (0.45) | 0.38 | |
| Physical activity high vs. low | 1.37 (0.49) | 0.01 | |
| Salt intake | – | –0.00001 (0.0001) | 0.86 |
| Fruits and vegetables intake (g/day) | 0.3 | –0.003 (0.001) | <0.0001 |
| Education level | 0.3 | <0.0001 | |
| Secondary vs. primary | –2.12 (1.09) | 0.05 | |
| University vs. primary | –3.73 (1.08) | 0.001 | |
| Men | |||
| Age | 4.1 | 0.22 (0.02) | <0.0001 |
| BMI | 5.1 | 0.97 (0.09) | <0.0001 |
| Alcohol intake | – | 0.02 (0.02) | 0.32 |
| Physical activity | – | 0.50 | |
| Physical activity medium vs. low | –0.02 (0.91) | 0.98 | |
| Physical activity high vs. low | 0.71 (0.89) | 0.42 | |
| Salt intake | – | 0. 0001 (0.0001) | 0.41 |
| Fruits and vegetables intake (g/day) | – | –0.001 (0.001) | 0.44 |
| Education level | 0.3 | 0.01 | |
| Secondary vs. primary | 4.71 (1.74) | 0.01 | |
| University vs. primary | 3.34 (1.72) | 0.05 | |
Abbreviaton: BMI, body mass index.
A significant SBP increase was related to BMI increase within the 4 categories (lean, BMI <18.5; normal, BMI ≤18.5 to <25; overweight, BMI ≤25 to <30; and obese, BMI ≥30) in both sexes (P for trend <0.0001). These results persisted after age adjustment for both sexes (Figure 2).
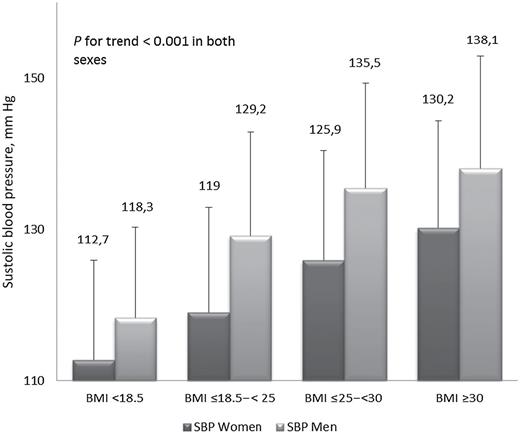
Mean systolic blood pressure by body mass index categories.
An additional multivariable model was established for both sexes by adding smoking status. It was shown that SBP was significantly higher in women who smoked vs. women who did not smoke. No significant association was found in men.
DISCUSSION
The main result of our study was that, aside from age, BMI had the strongest association with BP level; an SBP increase of almost 20mm Hg across the BMI categories was shown. Furthermore, after multiple adjustments, BMI persisted as the main contributory modifiable factor in the SBP multivariate model.
Body mass index.
The literature shows that obese people are more likely to be hypertensive compared with nonobese people.17 In a representative sample of the French population, the French National Nutrition and Health Survey showed that obese adults were at higher risk of hypertension than those who were nonobese.18
A strong association between obesity and BP level was shown in a large-scale cross-sectional survey that did not take into account other potential confounding factors; it was shown that 60% of hypertension may be attributable to obesity.19 The hypothesis that the relation could be mediated by another factor, in particular, salt, alcohol, or total energy intake, could not be ruled out. Our study confirmed this association and also highlighted that BMI is the main determinant of BP variability among the recommended lifestyle factors of consumption of salt, alcohol, and fruits and vegetables and physical activity level. In other words, stopping weight increase should be the first target in the general population to counteract the hypertension epidemic reported in epidemiological surveys.20
Salt.
Despite the widespread knowledge that salt consumption is a major nutritional factor associated with BP level,21,22 we found that age-adjusted SBP was not significantly associated with salt intake in women and not associated with either sex when adjusted for all parameters. Nevertheless, hypertensive participants consumed salt at a significantly higher rate than did those who were nonhypertensive. Several hypotheses can explain this finding. First, in our study, people who were treated with antihypertensive drugs and who could have a greater salt consumption were excluded. This may have led to minimization of the salt consumption range and, thus, the expected association. Second, dietary questionnaires covered only sodium intake from foods; total consumption was estimated by adding a constant for cooking meals and eating, which could have reduced the interindividual variation and, hence, made the potential association more difficult to identify.
Another explanation is that the known relationship between salt and BP in the general population was overstated and is more complex than once believed. Indeed, the lack of the expected relationship between salt and BP was found in 2 recent surveys carried out in Europe—1 in Croatia23 and another in France.24
Intake of fruits and vegetables, potassium, and fiber.
Intake of fruits and vegetables is known to be associated with lower BP levels.24–26 This association has been explained by the high potassium and fiber contents of these foods, which have been shown to reduce BP levels.27,28 Our data were consistent with those in the literature in that we found a significant negative age-adjusted relationship between SBP and intake of both fruits and vegetables and fiber in both sexes. Compared with BMI, the effects of these nutritional factors were small in our study. Nevertheless, promotion of their consumption would be one way to fight against weight gain, in addition to their direct antihypertensive effect.
Dietary sodium-to-potassium ratio.
We found a significant positive age-adjusted relationship between the dietary sodium-to-potassium ratio and SBP in both sexes, while an association with sodium was positively significant only in men and an association with potassium was negatively significant only in women. The relationship between BP and sodium-to-potassium ratio has been shown to be stronger than the relationship between BP and either sodium or potassium alone.29 This was pointed out as a success factor of the DASH dietary pattern.30 The dietary sodium-to-potassium ratio seems to be an interesting global parameter that makes it possible to take into account intake of salt and fruits and vegetables and their potential interaction with BP level.
Physical activity.
Regarding physical activity, the association with age-adjusted SBP was not significant in both sexes. More surprising in the full model, we found a weak but significant positive association between SBP and high physical activity level (vs. low physical activity level as a reference) in women. The possible explanation of these findings is that some volunteers could have recently modified their physical activity level based on their knowledge of elevated BP, introducing a reverse-causality bias. Indeed, in our study population, there were 15% of hypertensive participants for whom physical activity level was significantly higher than for those who were nonhypertensive.
Another potential explanation is that the IPAQ-sf failed to report a valid estimation of physical activity. The really low proportion of women in the high physical activity level (10.8%) although the IPAQ-sf is known to overestimate the moderate and vigorous physical activity, supports this hypothesis.15Furthermore, a recent review of the literature challenged the IPAQ in its short form.31
Tobacco use.
We found a negative association between smoking status and BP level in women. This finding has been reported in several epidemiological studies.32 However, even though no independent chronic effect of smoking on BP has been proven to date,4 smoking remains a powerful cardiovascular risk factor, and smoking cessation should be promoted.
Alcohol consumption.
We report the possible relationship between BP level and alcohol consumption.4 It should be noted that, as is expected in a French cohort, wine was the primary type of alcohol consumed (66% of alcohol consumption in both sexes); thus, BP was highly correlated with wine consumption. This suggests that the cardiovascular protection of wine consumption reported in the literature33 is probably not mediated by BP level.
Strengths and limitations.
The main strength of our study was that we investigated the relationship between a BP measurement using standardized protocol and lifestyle factors in a large general population of untreated French adults. Furthermore, the quality and completeness of the dietary investigation obtained with a validated method enabled us to closely investigate the relationships between the different nutritional factors and BP.
Nevertheless, there were some limitations. First, the sample of volunteers (both for the study and for the consultation participation) was probably not representative of the global French population, particularly in terms of health conscientiousness. Indeed, compared with the characteristics reported in the ENNS, which used a multistage random sample of the French population.34 In our study there were fewer smokers, participants had lower BMIs, and fruit and vegetable intake was higher, particularly in men. Internet-based recruitment could be another limitation; however, there is a wide range in Internet use across socioeconomic strata in France.11 Second, the cross-sectional design of our study did not take into account that many participants could have recently modified their lifestyle in response to elevated BP, introducing a reverse-causality bias. With such a design, collected data could then be poorly representative of previous years. In this respect, the future analyses of the ongoing cohort study, which is planned for follow-up of the participants over a 10-year period, will investigate the nutritional and behavioral factors associated with hypertension incidence.
In conclusion, the salient result of our study is that of all well-accepted modifiable factors, BMI was the main determinant of BP level. This finding introduces the hypothesis that the main target among modifiable factors for fighting an increase in BP in the general population should be prevention of BMI increase.
DISCLOSURE
The authors declared no conflict of interest.
ACKNOWLEDGMENTS
We thank all volunteers who participated in the NutriNet-Santé Study and all healthcare professionals and staff at the coordinating center. We extend special thanks to Laurent Bourhis and Fabien Szabo de Edelenyi, the data managers. The NutriNet-Santé Study is supported by and has received grants from the following institutions: Ministère de la Santé, Institut de Veille Sanitaire, Institut National de la Prévention et de l’Education pour la Santé, Fondation pour la Recherche Médicale, Institut de Recherche en Santé Publique, Institut National de la Santé et de la Recherche Médicale, Institut National de la Recherche Agronomique, Conservatoire National des Arts et Métiers, and Université Paris 13.
REFERENCES
